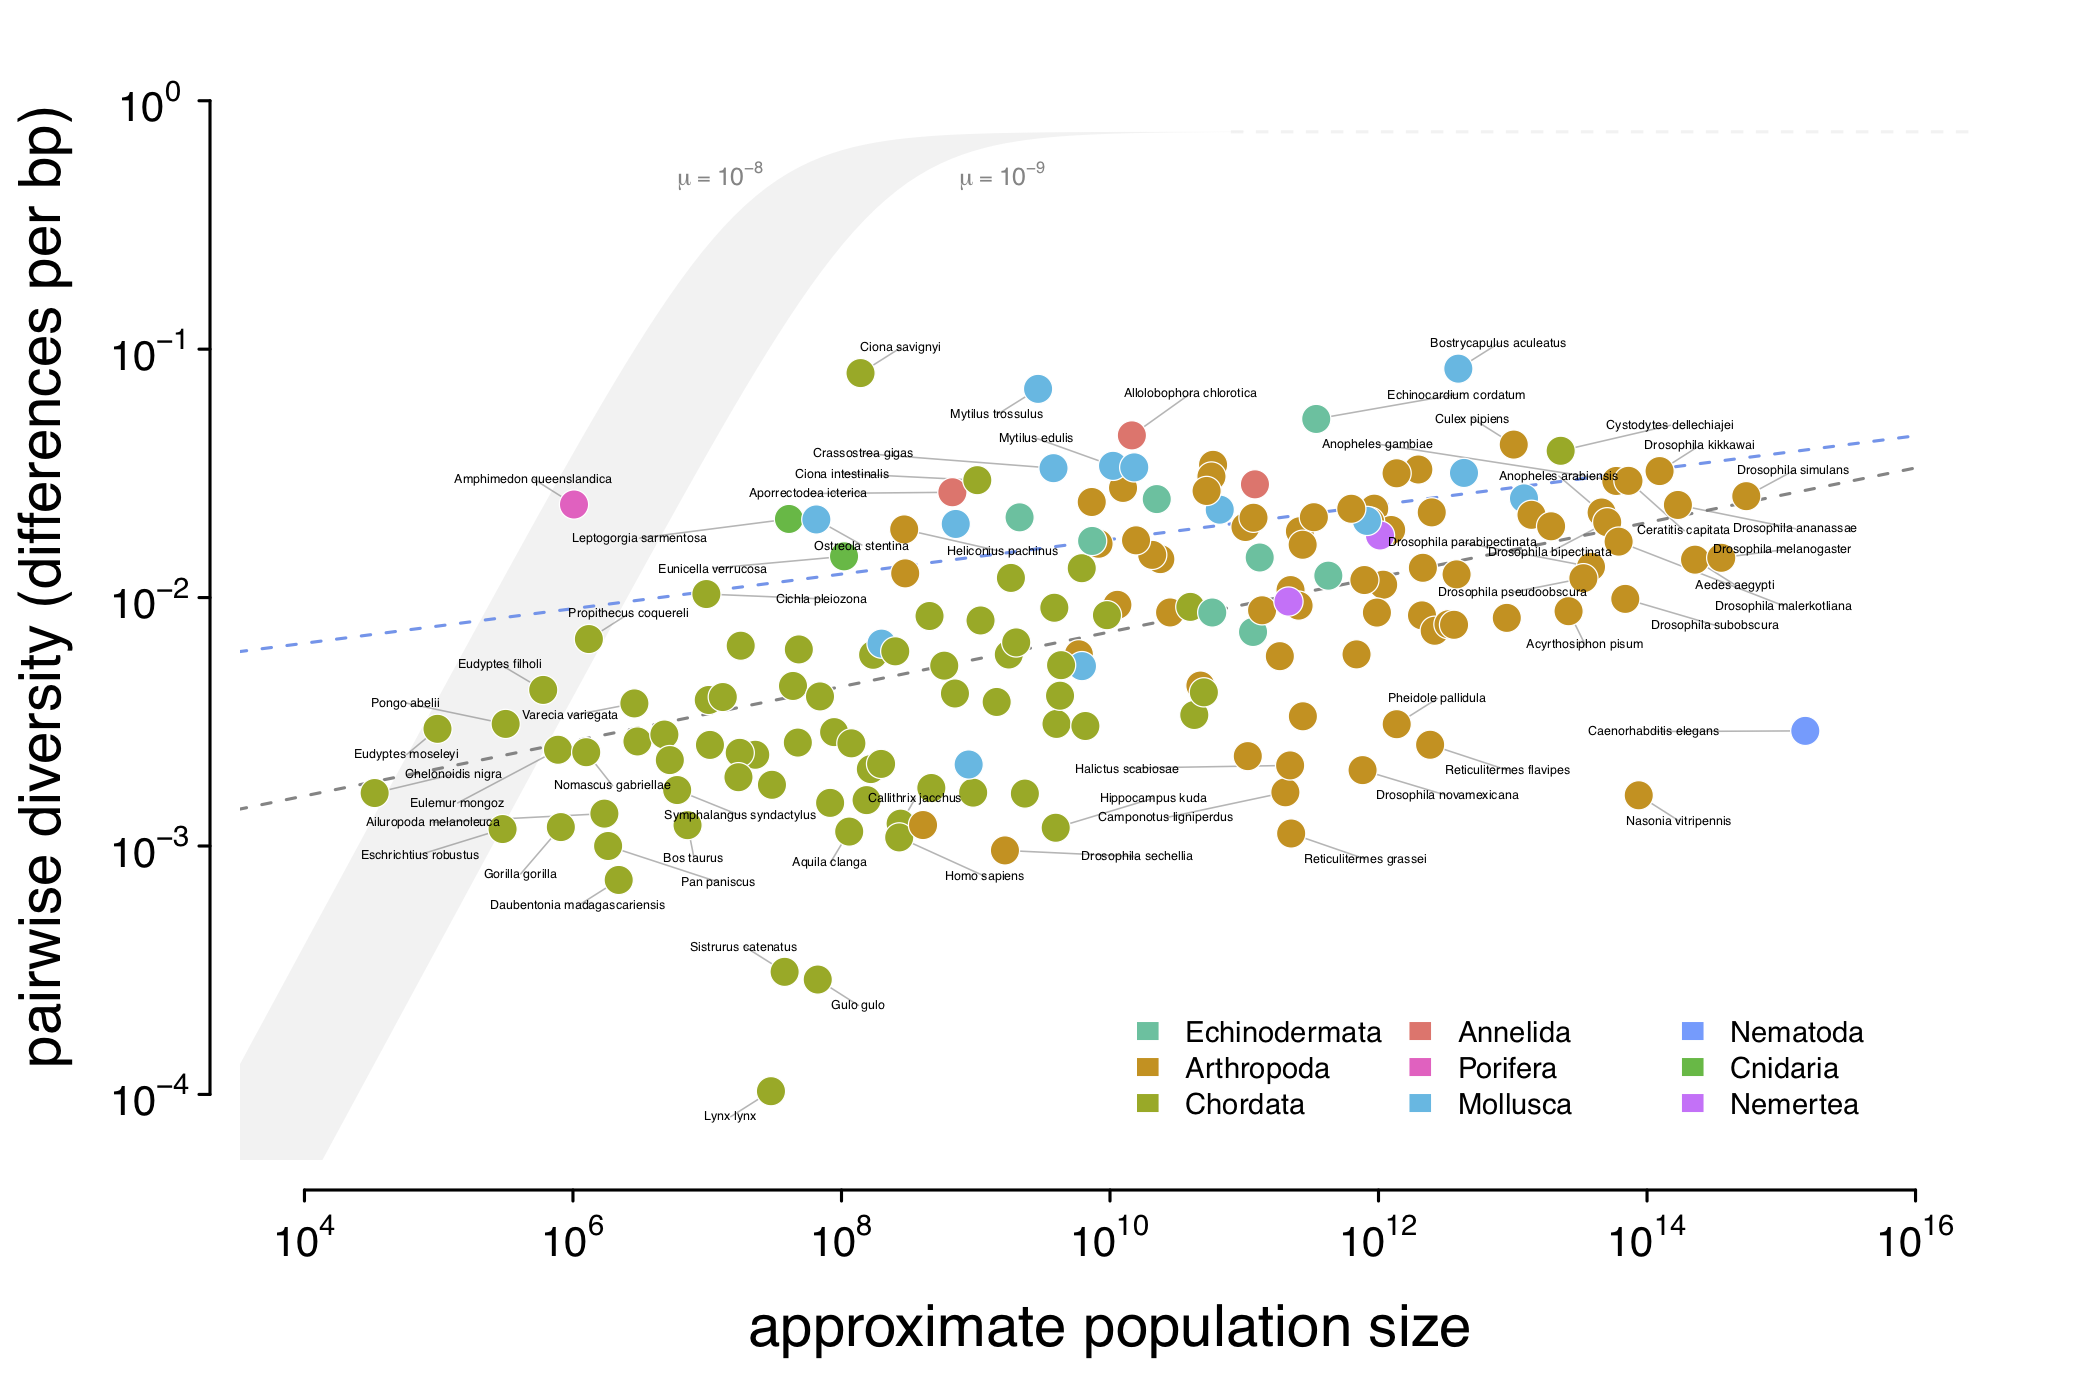
Across-species Population Genetics and Lewontin’s Paradox of Variation
Detecting Polygenic Adaptation From Temporal Genomic Data
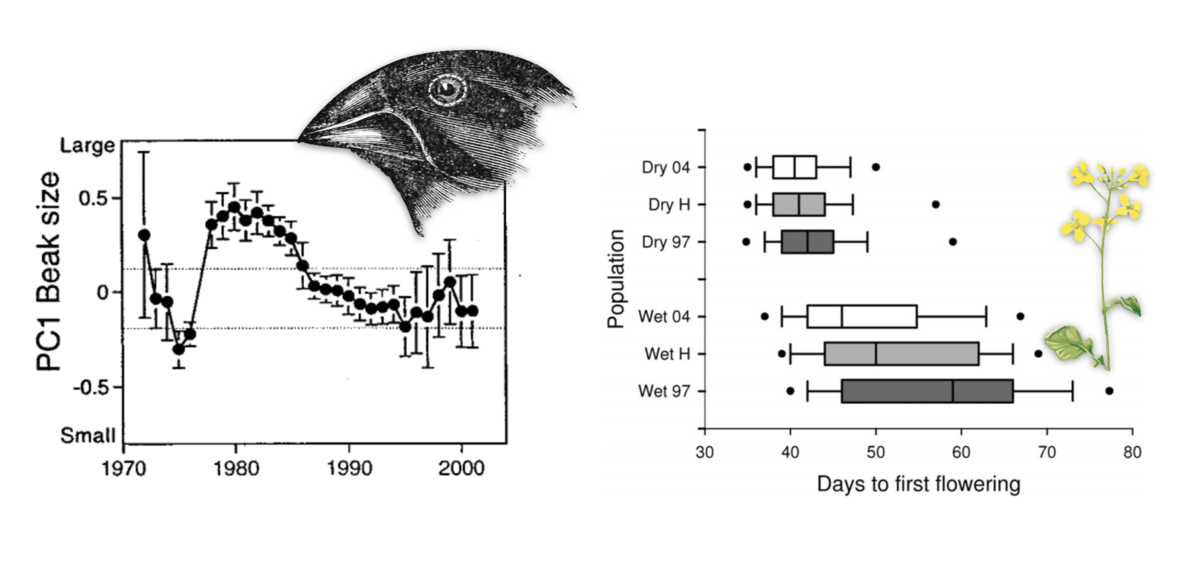
During my PhD, I became fascinated by the problem of detecting rapid polygenic1 adaptation. We have seen extensive examples of rapid polygenic adaptation in natural populations, where over short “ecological” timescales a population’s trait average changes due to an environmental change or other stimulus. However, detecting such adaptation at a genomic level is challenging, since the effects of selection are distributed across all of the many sites contributing to the trait, and the subtle allele frequency changes can be mistaken for random genetic drift. This leaves us in an unfortunate place: while ecologists and evolutionary biologists can observe rapid phenotypic changes in natural populations, detecting these adaptive events in genomic data that is now widely available is incredibly difficult. Yet, we need to understand how rapid phenotypic adaptation affects genome-wide variation to have a complete view of how evolution is working in populations. Connecting evolutionary quantitative genetics with population genomic data is a central theme in my research.
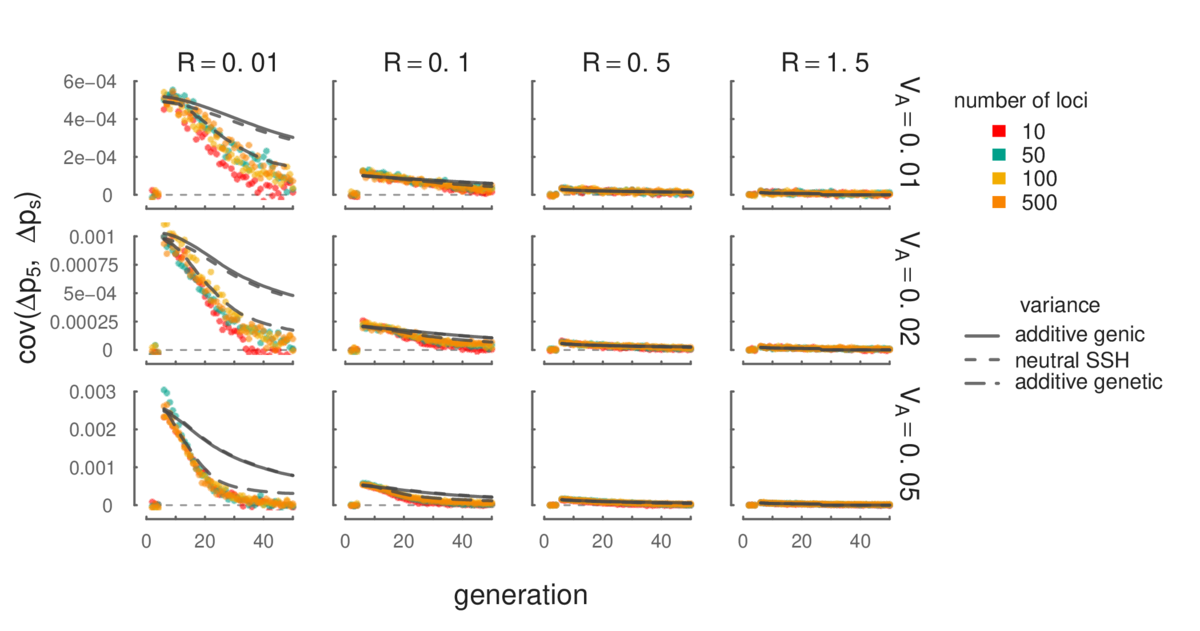
In my PhD work, Graham Coop and I show that temporal genomic data (allele frequencies sampled from a population over many generations) provides a way to detect polygenic adaptation over very short timescales. The signal we use is that a neutral allele (i.e. an allele that does not directly affect fitness) behaves differently through time when selection is present. In particular, the allele frequency changes each generation (e.g. \(\Delta p_0 = p_1 - p_0, \Delta p_1 = p_2 - p_0, \) etc.) under drift are independent, and consequently the covariance between allele frequency changes (e.g. \(\text{cov}(\Delta p_t, \Delta p_s)\)) is expected to be zero. However, when heritable fitness variation exists in the population, this creates covariances in allele frequency changes that we can directly measure from genomic data. We call this temporal autocovariance. In our Genetics paper, The Linked Selection Signature of Rapid Adaptation in Temporal Genomic Data we work out mathematical expressions for its strength and show how we can estimate additive genetic variance for fitness using measured levels of temporal autocovariance.
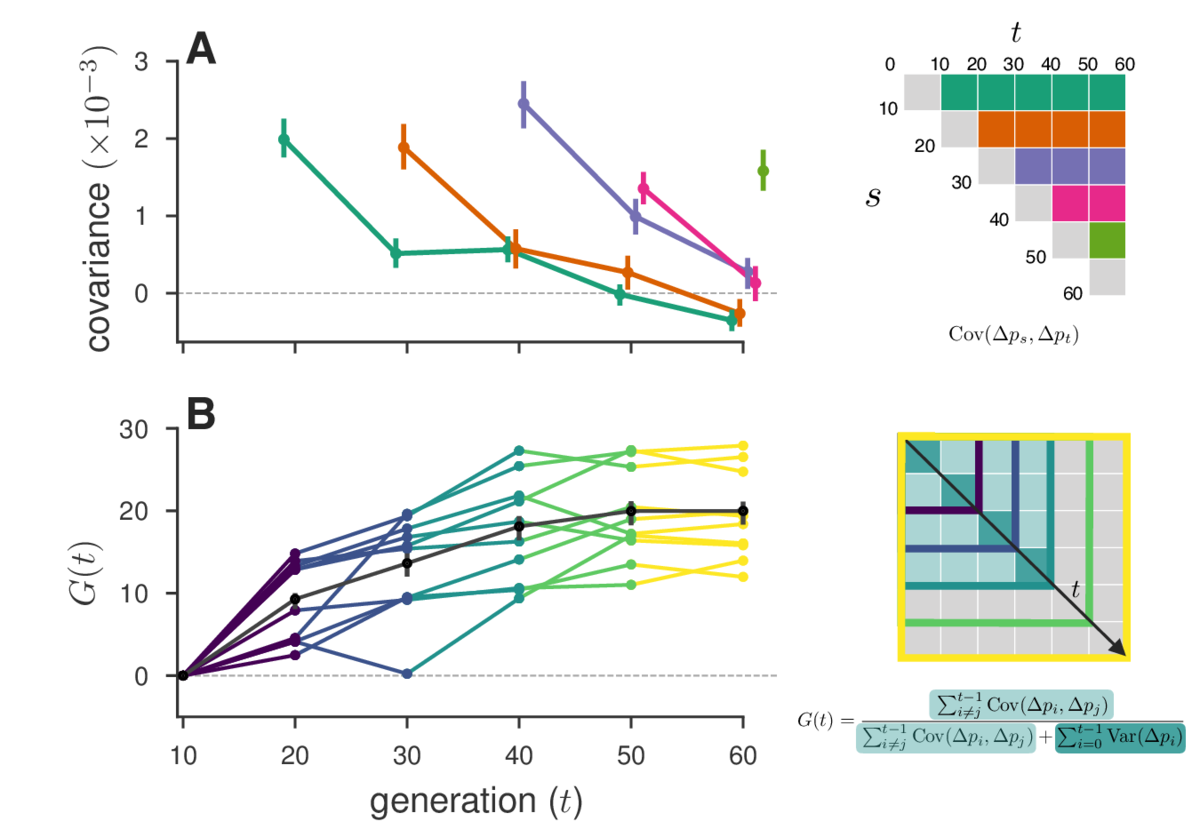
In addition to allowing us to detect polygenic adaptation from temporal genomic data, temporal autocovariance also allows us to address a long standing issue in evolutionary genetics: how can we quantify the effects of selection and drift on genome-wide allele frequency changes? This is a long-standing problem in evolutionary genetics, going back to the vitriolic debates between R.A. Fisher and Sewall Wright in the 1940s. For the first time, we can directly partition how much of the variance in allele frequency change is directly caused by linked selection. In our Genetics paper, we have developed an estimator, G, which quantifies the proportion of the total variance in allele frequency change that is due to linked selection2.
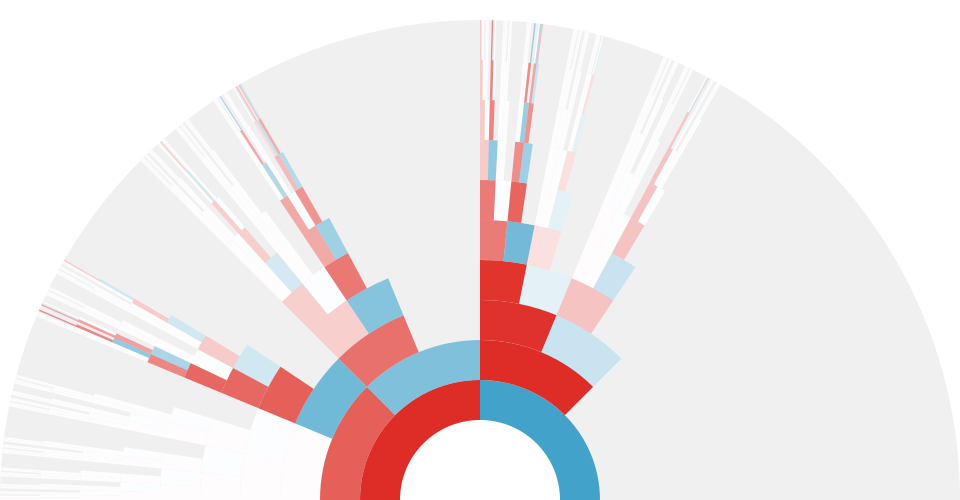
In a second paper, published in PNAS, we apply these ideas to three published temporal genomic datasets. We find extensive evidence in three studies that linked selection effects genome-wide allele frequencies over short timescales. Overall we estimate that at least 17% to 37% of allele frequency change is driven by selection in these experiments (using our measure G mentioned earlier). Results from a reanalysis of one of these studies is shown below:
Finally, we also find evidence of reversals in the direction of selection in the Barghi et al. (2019) data, indicated by negative temporal covariances over long periods of time. A huge benefit of our approach is that we can tease out a signal of these more complicated selection dynamics with genome-wide data that may not be evident by analyzing individual allele frequency trajectories.
Overall, this work begins to address two long-standing problems in evolutionary biology: how can we detect polygenic adaptation over short timescales, and how can we quantify the effects of drift versus selection on genome-wide variation? As more temporal datasets continue to be created, we can also begin to reconcile our short-term estimates of the genome-wide impact of selection with estimates of how selection shapes genomic diversity over longer periods, from single contemporaneous samples. Furthermore, I hope to quantify the extent to which fluctuating selection acting over short timescales are occurring in natural populations, and the impact they have on genetic variation.
X Chromosome Genealogies
During summer 2015, Graham, Steve Mount, and I worked out a set of probability distributions that model the number of blocks and their lengths one shares with an X chromosome ancestor $k$ generations back in the past. Additionally, we modelled the number and lengths blocks one shares with a present-day relative on the X chromosome. As ancestry services like 23andme and ancestry.com use identical by descent blocks1 between individuals to infer shared ancestry, Graham and I were curious how much information about ancestry is in X chromosomes and what these block distributions look like.
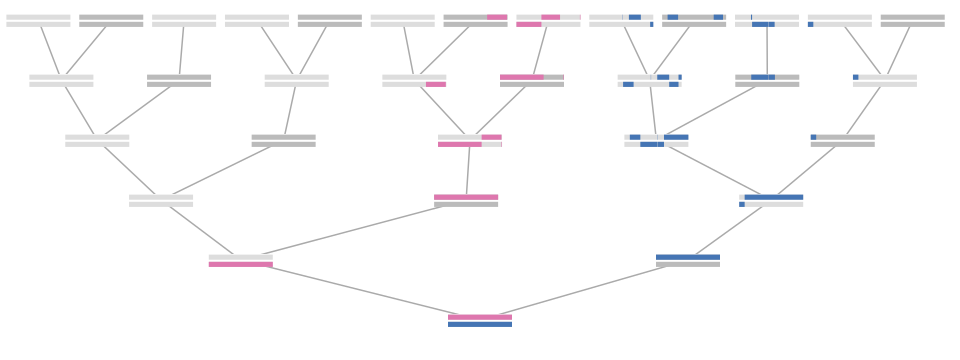
Since the heterogametic sex only has one X ancestor (e.g. in humans, males have only one X ancestor in the previous generation — their mother), one’s number of X ancestors $k$ generations back is curiously enough the $(k+2)^\text{th}$ Fibonacci number. Additionally, X chromosomes only undergo meiotic recombination in females, so the distribution of recombinational meioses varies depending on the lineage to a particular ancestor. This leads to some neat combinatorics that we use in our derivation of our distributions.
Graham, Steven, and I have written up this manuscript, and a preprint is now available bioRxiv. As an scientific outreach component, I’ve also written a blog post about X genealogies and recent ancestry. See also Graham’s terrific blog posts on one’s number of genetic ancestors, how much genome one shares with a particular ancestor, and the Thanksgiving question on everyone’s mind: how of my genome do I share with a particular cousin?